How to Analyze Performance in Business Central to Improve Speed
If you’ve noticed that certain pages in your Business Central environment, take longer to load or are sluggish when updating, you’re not alone. Many users’ express frustration over slow-loading pages, especially when using features like the search bar or filters. Fortunately, there is a way to analyze the system performance to pinpoint the cause of the slowness and improve your experience.
Identifying Performance Issues in Business Central
Are certain operations within your Business Central environment running slowly? If so, you can easily analyze the system’s performance to identify the underlying issues. Start by clicking the question mark icon located in the top right corner of your browser. This opens the Help menu where you can select the Help & Support option.
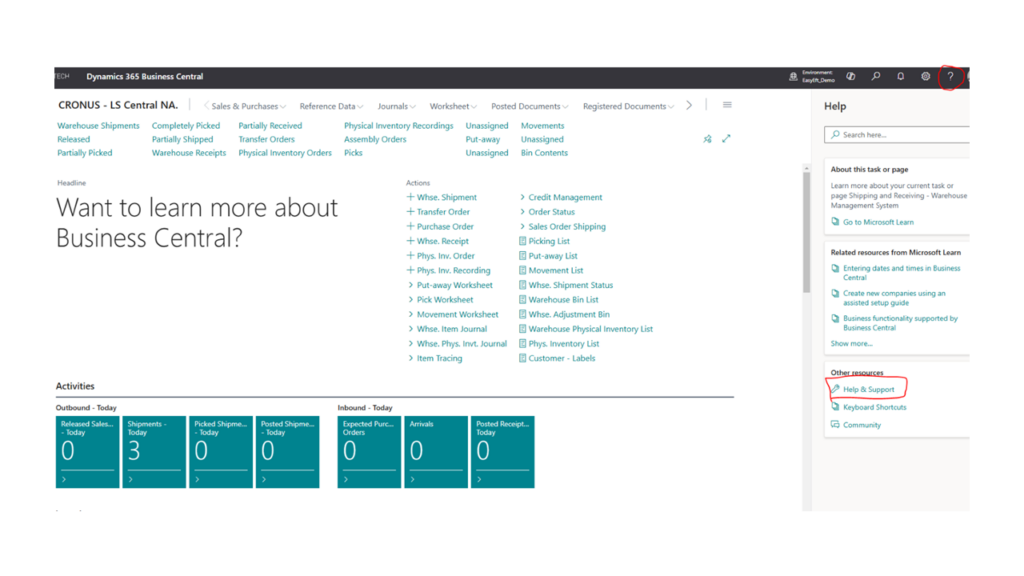
Business Central Help & Support
Using the Performance Profiler Tool
After selecting Help & Support, you’ll be taken to a page containing system and troubleshooting information. In the troubleshooting section, you’ll find an option to Analyze Performance. Clicking this will open a new window where you can run the Performance Profiler tool while performing actions that are causing the slowdown.
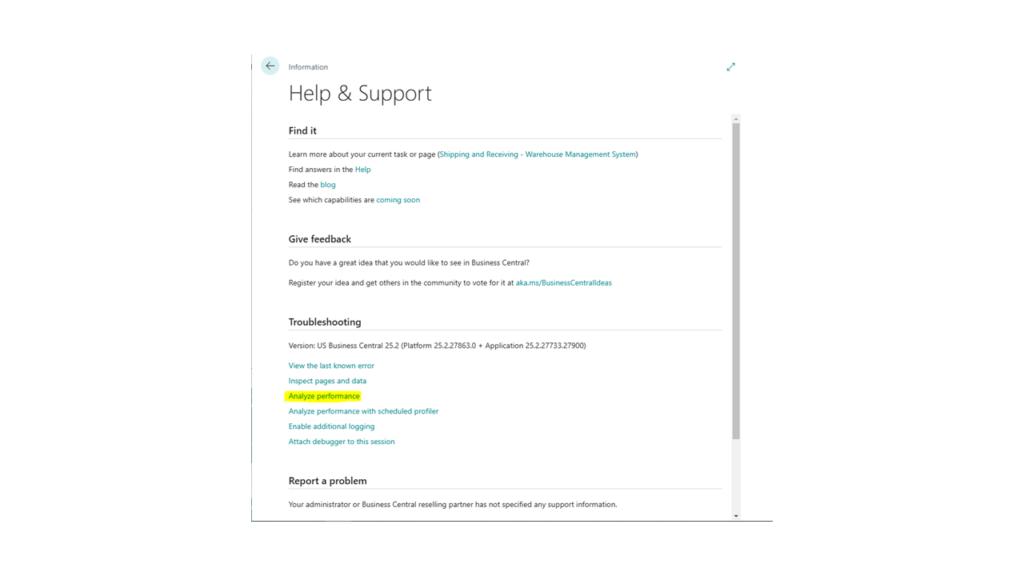
Analyze Performance
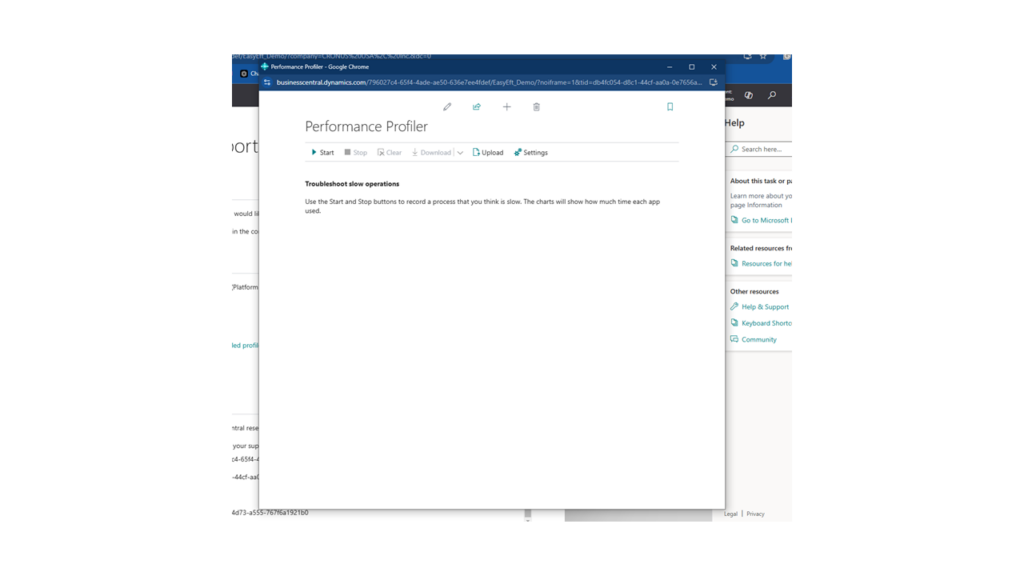
Starting the Performance Profiler
Once the Performance Profiler window opens, click the Start button to begin recording your Business Central session. Then, proceed with the task that’s causing the system to run slowly. After completing the task, stop the profiler to review which apps were active and how long each took to process.
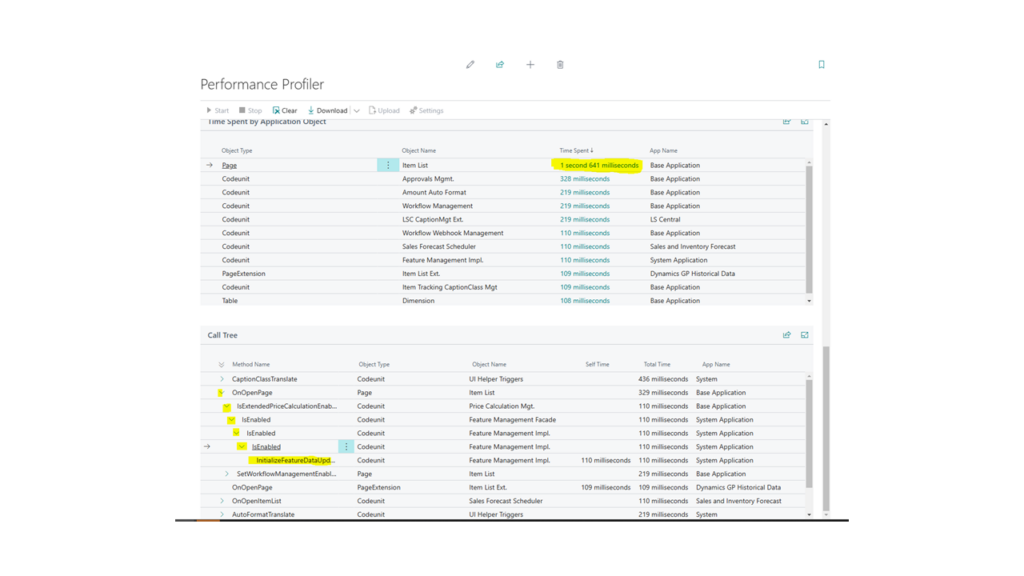
The results will show you the performance details of each app involved, which can help identify the cause of the lag. For example, when I opened the Item List Page in our demo environment, the profiler displayed which apps were active and their corresponding load times.
Exploring Technical Information for Deeper Insights
If you need more detailed information, click the Show Technical Information option. This will provide a deeper view of the time spent by each app, and you can even open the Call Tree for each app to identify which specific parts might be causing the slowness.
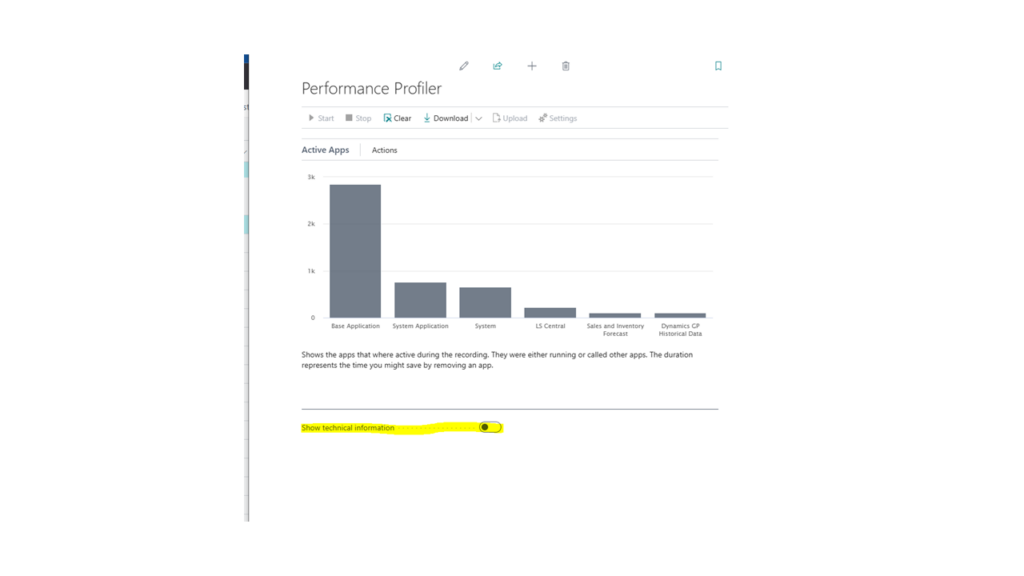
Sharing or Downloading Performance Data for Further Review
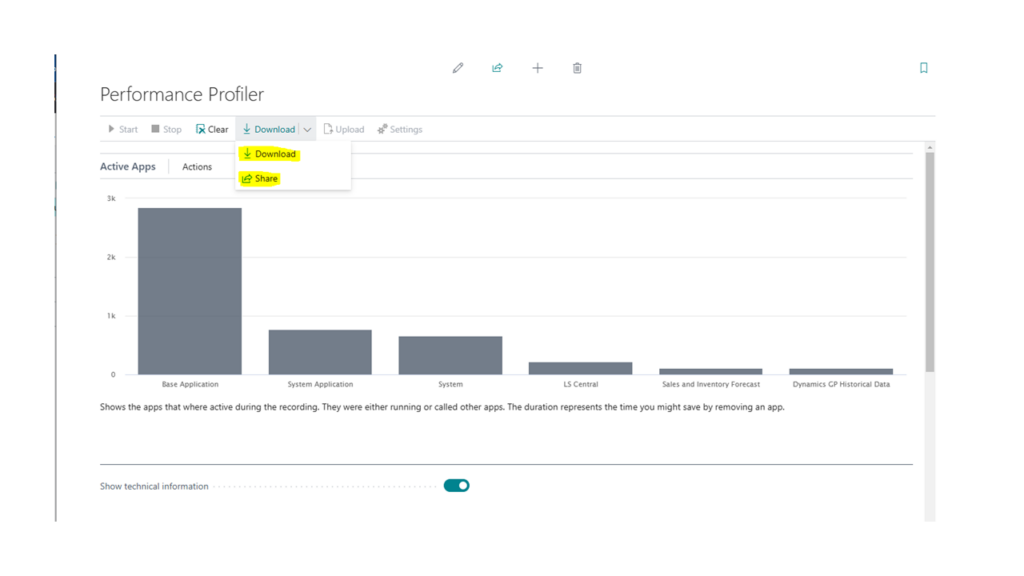
Once you’ve analyzed the performance data, you have the option to download or share the results. This feature is available through the Download option in the menu. You can send the results to your internal team, Microsoft support partner, or third-party developers to help resolve the issues.
Troubleshooting with Performance Data
The data collected from the Performance Profiler helps you determine whether the issue stems from a base app, a custom app, or a third-party app. After gathering this information, you can work with your team or partners to investigate and fix the root cause of the performance slowness.
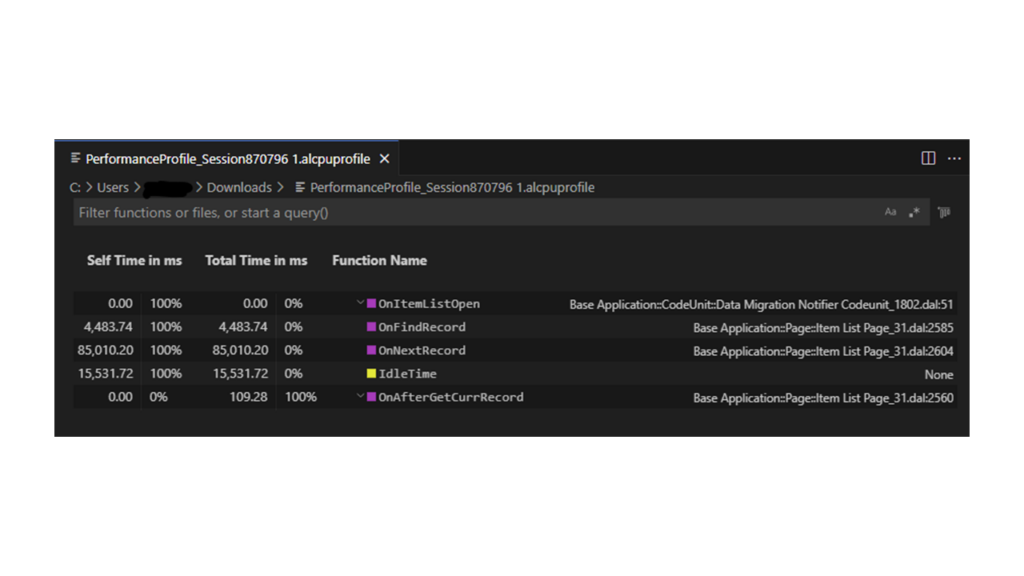
When developers analyze downloaded results, they can open it Visual Studio Code
Conclusion
By using the Performance Profiler in Business Central, you can easily track down the source of slow performance and work towards a resolution. Whether the issue lies in custom, base, or third-party apps, understanding which apps contribute to lag will empower you to fix the problem and improve the speed of your environment.
Ready to see how Business Central can transform your operations? Contact us to learn more and get started today!






Leave A Comment