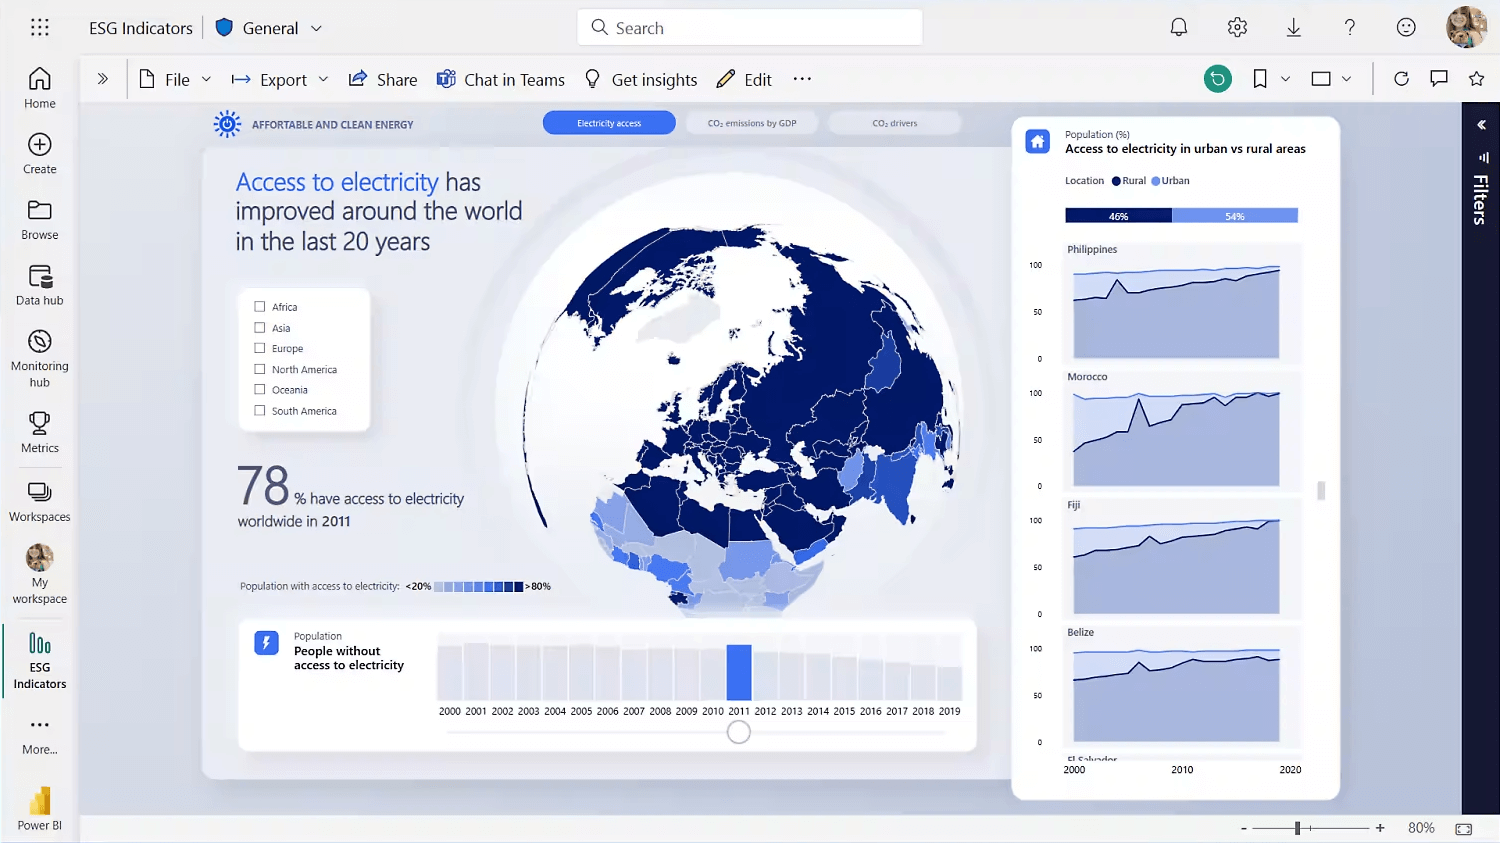
Connect to any data and easily add visuals to your everyday apps
Connect to any data and easily add visuals to your everyday apps
Sales Tracking Create a dashboard to see real-time sales performance and trends.
Customer Insights Visualize customer data to understand buying habits and preferences.
Project Management Track project progress with charts and graphs showing milestones and deadlines.
Financial Analysis Display financial data in easy-to-read reports for budgeting and forecasting.
Marketing Analytics Use visuals to analyze campaign performance and measure ROI.
What you can do with Power BI
What you can do with Power BI
Connect to Data Sources
Easily connect to various data sources like databases, spreadsheets, and online services.
Create Interactive Reports
Design detailed and interactive reports with charts, graphs, and maps to visualize your data.

Build Dashboards
Combine multiple reports and visualizations into a single dashboard for a comprehensive view of your data.

Analyze Trends
Use built-in analytics tools to identify trends, patterns, and insights in your data.

Share and Collaborate
Share reports and dashboards with team members and collaborate on data-driven decisions.

Automate Data Refreshes
Set up automatic data refreshes to ensure your reports and dashboards always display the most current information.
Stay Connected